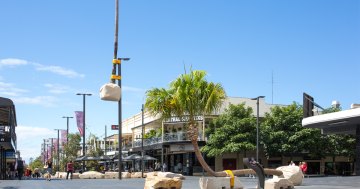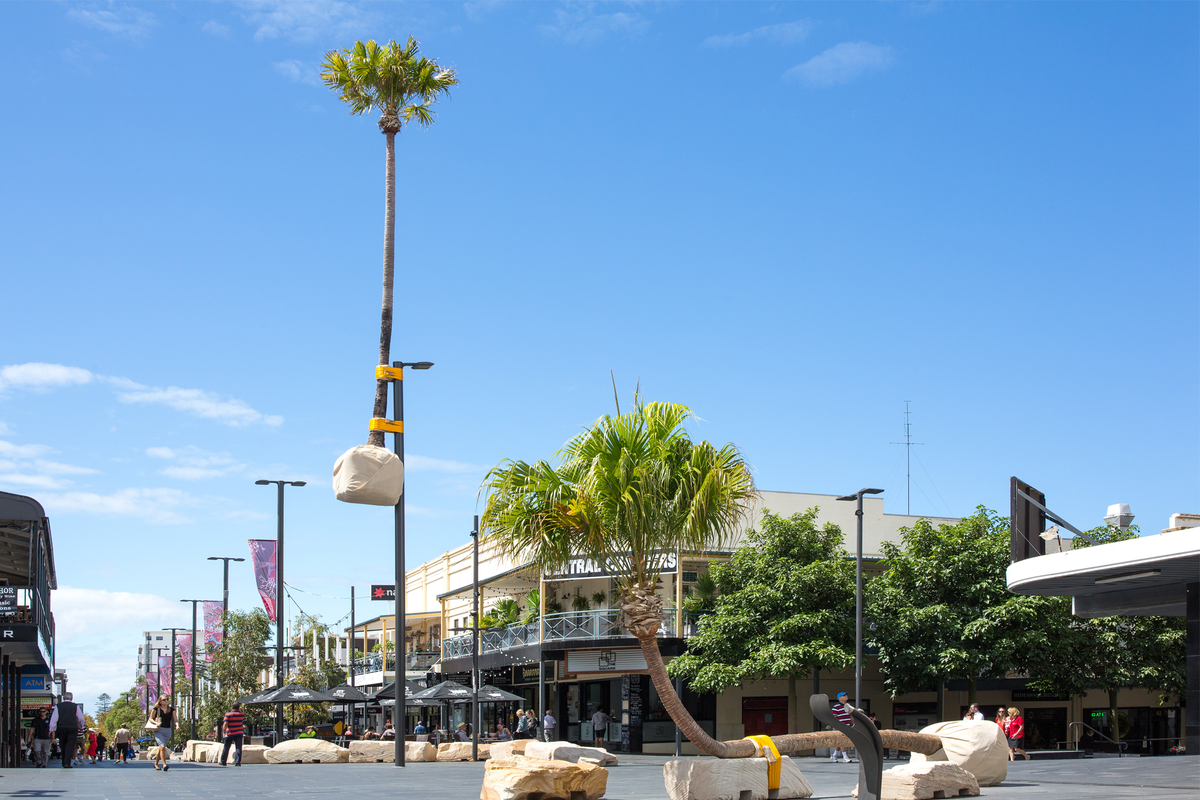
Crown Street Mall’s palm tree is notorious, controversial – and maybe that’s the point. Photo: Mike Hewson, courtesy of Wollongong City Council.
How much does the average ratepayer spend on Wollongong’s iconic palm up a pole each year?
At Region, we’ve crunched the numbers on where your rates go and where that pesky palm – which sparked furious debate in council chambers earlier this year – sits in the hierarchy of big-ticket items.
All the numbers come from Wollongong City Council’s resourcing strategy, and we’ve run them past a finance whizz to double-check our working.
Be warned – this article contains a lot of maths. If you make it to the end you’ll be rewarded with how much you chip in for the controversial palm.
First and foremost, not all of the council’s budget of about $367 million total revenue comes from rates.
About nine per cent of it comes from grants the council secures from the state or federal government, another eight per cent from capital grants and contributions from significant developments, such as West Dapto, and about 14 per cent from user fees and charges, such as pool entry fees.
The $247 million in rates and annual charges the council raises from 89,476 dwellings across the local government area (LGA) accounts for about 67 per cent of the budget. The remaining two per cent of the budget comes from interest and returns on investments.
The size of your rates bill will depend on a few things, like whether your property’s rating category is residential, business, farmland or mining, and the value of your land.
Depending on the type of land you have, or services you use, you might incur additional charges.
To get an idea of where your rates go, we’re going to use the example of a residential bill for a freestanding home – about $600 per quarter, or $2400 per year. This includes a fixed stormwater charge of $25 and a fixed waste management charge of about $125.
The council provides dozens of services, so for this breakdown we’re going to take the six of the most expensive, which account for just over half of the council’s total annual spend.
These are, in order of cost:
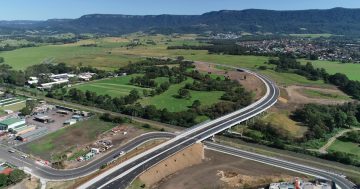
Transport services covers roads, bridges, footpaths, cycleways, carparks, boat ramps and associated costs like planning, streetlights, street sweeping and road safety.
This costs a little under $56 million per year, about 16 per cent of the council’s total spend, or $96 of our hypothetical $600 rates bill.
Waste services are a bit tricky. With a budget of $53 million a year, it’s one of the council’s biggest spends, but it brings back in revenue about what it costs to run. Part of that revenue is the fixed $125 quarterly management charge – about 25 per cent of our $600 rates bill.
Parks and sportsfields at $25 million per year are about seven per cent, or $42 from a $600 rates bill.
Stormwater, at $24 million per year is also about seven per cent of the bill – another $42.
Aquatic services at $17 million per year – about five per cent, or $30.
Libraries, at $11.6 million per year are three per cent, or $18 per bill.
If you’re keeping count, that’s $353 of our $600 rates bill on roads, parks and sportsfields, stormwater, swimming pools, libraries and waste management.
A big chunk of the remaining $247 goes towards development assessments, paying employees, information and technology, planning, regulatory compliance and city centre management.
A smaller amount goes towards things such as environment services like Landcare, tourist parks, ageing and disability support programs, community programs, youth services, art, memorial gardens and cemeteries.
It’s not a bad buy compared to say, a regular gym membership. A $50 per week membership costs the same per quarter as our example rates bill.
When we’re all looking more closely at our budgets, making the most of council services that we’re already paying for, such as libraries, pools, leisure centres, or a picnic in the botanic gardens could get the most value out of your rates, and potentially make some savings in other areas too.
And the palm? It costs $35,000 annually to maintain. That’s 0.009 per cent of the council’s spend – or about 5c on each quarterly bill.
Like it or loathe it, at the end of the day, it’s peanuts.


